
Figure 5.
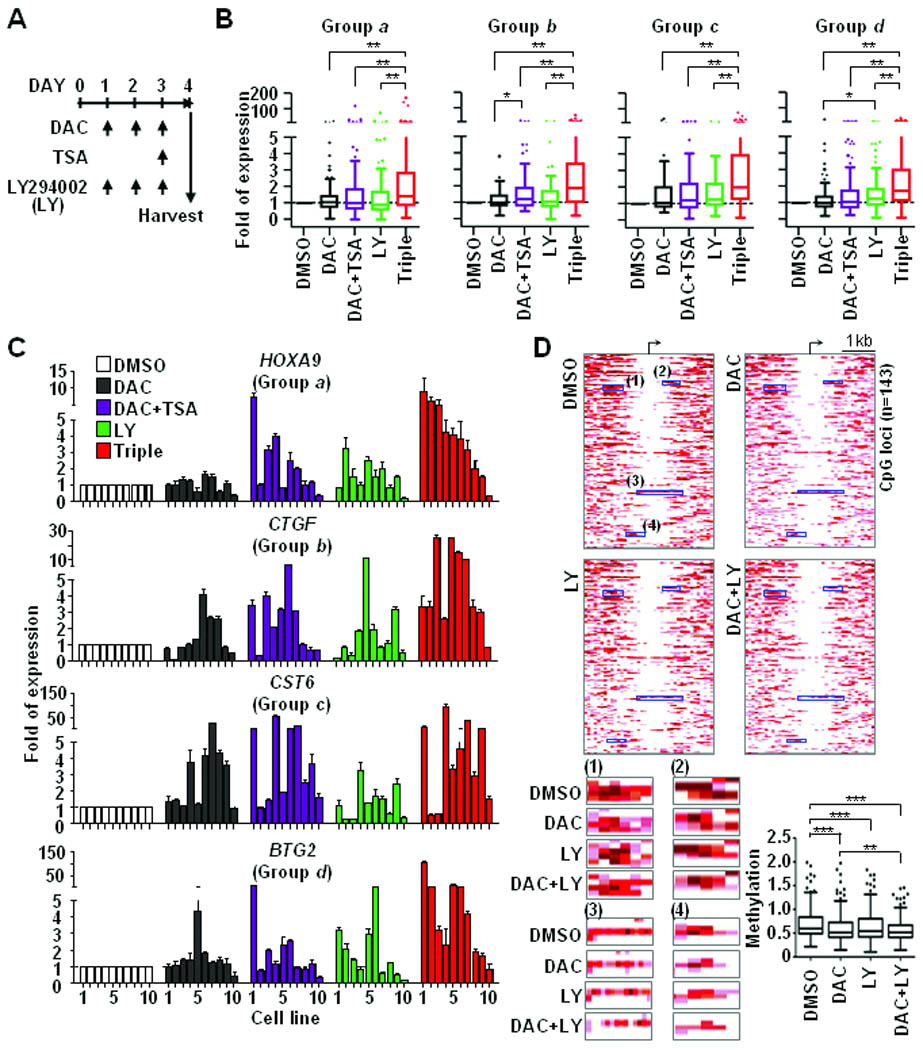
Combined PI3K/AKT-targeted epigenetic therapies synergistically relieve epigenetic repression. A, scheme chart illustrates drug treatment plan. A DNA demethylation reagent (DAC, 1 µM), an inhibitor of histone deacetylases (TSA, 0.2 µM) and a non-specific PI3K inhibitor (LY294002, 5 µM) were used to treat 10 breast cancer cell lines as indicated. B, RT-qPCR was conducted to measure expressions of 40 genes after drug treatments. Values of gene expression in each treatment were normalized by comparing those of DMSO control. Following categorization showed in Fig. 3, genes from groups a, b, c and d were summarized in four box-plots separately. Three independent experiments were conducted and representative data was shown in figures. C, expression changes of representative genes, i.e. HOXA9, CTGF, CST6, and BTG2, are shown. The order of cell lines: 1 MDA-MB-453; 2 MCF7; 3 ZR-75-1; 4 BT-549; 5 MDA-MB-468; 6 BT-474; 7 T-47D; 8 HCC1954; 9 Hs578T; 10 MDA-MB-231. D, global MBDCap-seq was conducted to analyze DNA methylation changes in drug-treated T-47D cancer cells. Enrichment levels of DNA methylation in promoter CpG islands were statistically normalized. Heatmaps, upper panel, show differential methylation patterns of 143 loci that were plotted in a 4-kb window (2-kb up- and down-stream from the transcription start site). The detail methylation changes in four representative regions in heatmaps are illustrated at lower panel (left), while box plots (right) summarize the overall methylation levels of 143 loci in four different treatment groups. Significance of differences among drug treatments was determined by Student’s t-test and One-way ANOVA test. *P<0.05, **P<0.01, and ***P<0.001.