
Figure 6.
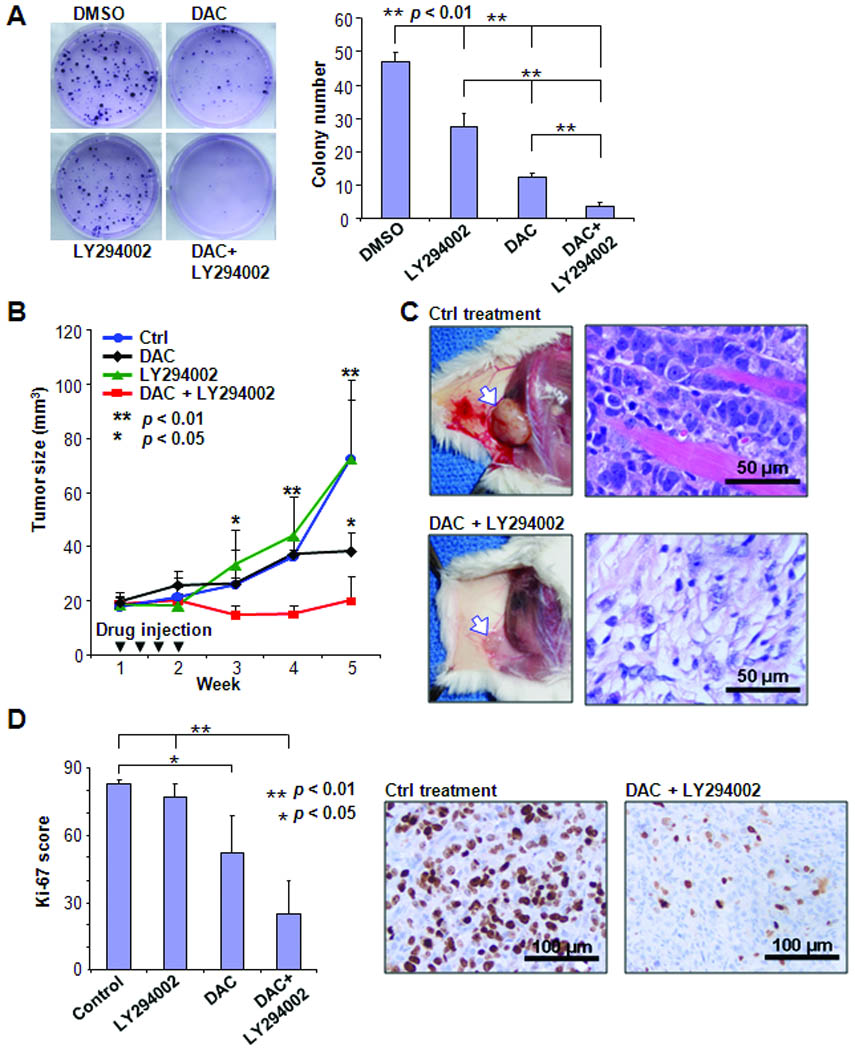
Combinatorial treatment suppresses tumor growth. A, T-47D cancer cells were treated with DAC or/and LY294002 and subjected to colony counting. Left, photos show representative from each treatment. Right, results were derived from three independent experiments. B, five million T-47D cancer cells were inoculated on flank of each female NOD SCID mouse. Each treatment was conducted on 5 experimental animals by intratumor injections of either drugs or vehicle control for totally four times during first two weeks of treatment. Tumor growth was carefully followed until 5 weeks after beginning of treatment. C, photos illustrate representative xengraft tumors in control (upper panel) and drug treated (lower panel) mice. Arrow indicates inoculated tumors. H&E stain shows that cancer cells invaded pink muscle-fibers in control xenograft tumor, while morphology of tumor cells was dramatically changed after drug treatment. D, Immunohistochemical analysis of Ki-67 was performed in xenograft tumor tissues. Left, Ki-67 scores measured from three tumors in each group were summarized in column figure. Right, representative Ki-67 immunohistochemical sections from tumor tissues treated with either vehicle control or drugs.