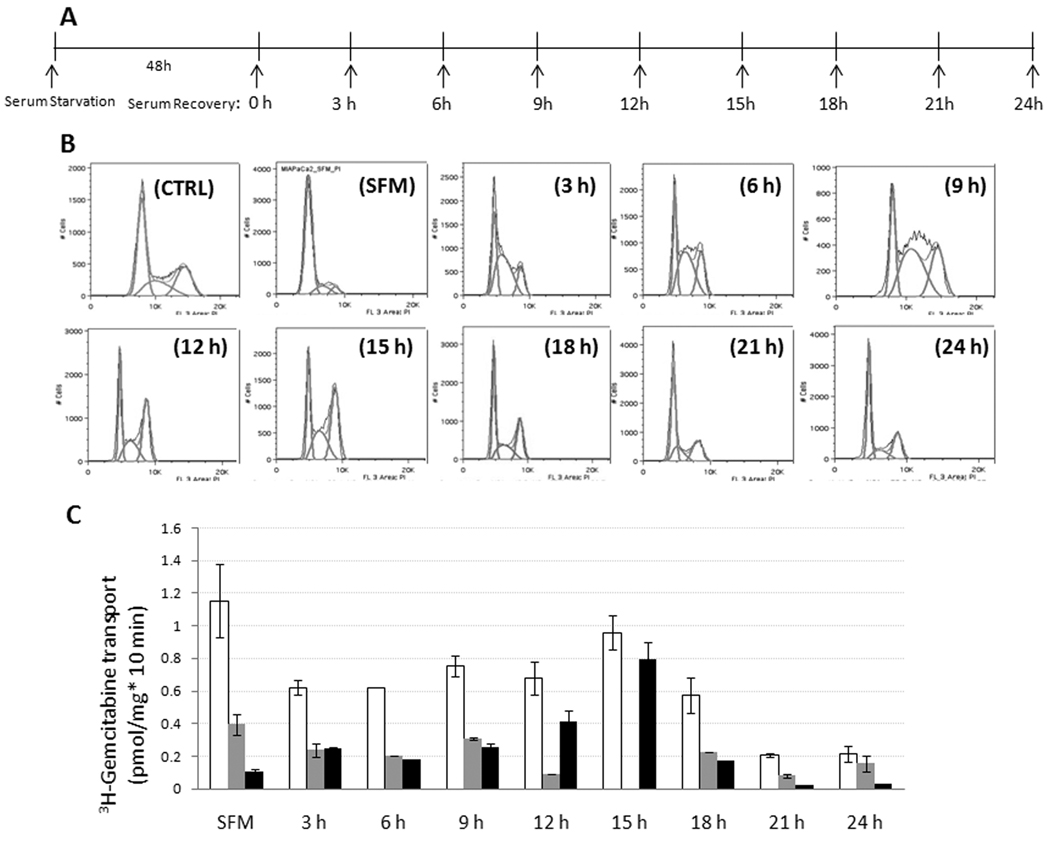
Figure 3. hCNT1-mediated 3H-gemcitabine transport activities varied among cell cycle synchronized MIA PaCa-2 cell populations.
A. A schematic layout for cell synchronization by serum starvation. MIA PaCa-2 cells were serum starved for 48 h and recovered with media containing 20% FBS and 5% horse serum in 3 h intervals for 24 h. B. Flow cytometric analysis of cell cycle distribution of MIA PaCa-2 cells following serum synchronization. A representative cell cycle distribution pattern is shown. C. 3H- gemcitabine transport analysis in serum synchronized MIA PaCa-2 cells. Total (open bars), hENT1 (grey bars)- and hCNT1 (black bars)-mediated gemcitabine transport levels are shown. Data are mean ± SD, n=3. SFM; serum free media, CTRL; control.

