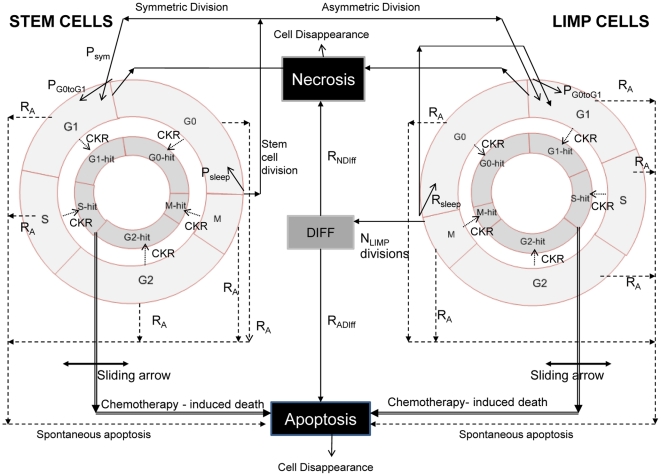
Figure 1. Generic cytokinetic model for tumor response to chemotherapy.
The generic cytokinetic model used. LIMP: LImited Mitotic Potential cells. DIFF: terminally differentiated cells. G1: Gap 1 phase. S: DNA synthesis phase. G2: Gap 2 phase. M: Mitosis. G0: dormant phase. Hit: cells lethally hit by chemotherapy. The arrow indicating chemotherapy-induced death is a sliding arrow, with position dependent on drug pharmacodynamics. For a definition of the depicted model parameters see Table 1.

