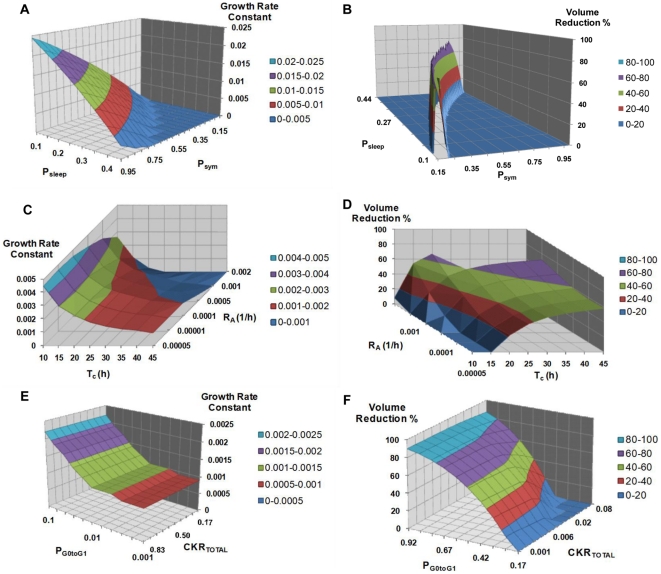
Figure 4. Selected combined effects of several model parameter combinations.
Combined effects of selected parameter combinations on tumor free growth rate (first column) and volume reduction after therapy (second column). Different colors correspond to distinct ranges of the growth rate constant value or the tumor volume reduction percentage. Panels A, B: Combined effect of Psym and Psleep. Panels C,D: Combined effect of Tc and RA. Panels E,F: Combined effect of CKRtotal and PG0toG1. For a definition of the depicted model parameters see Table 1.

