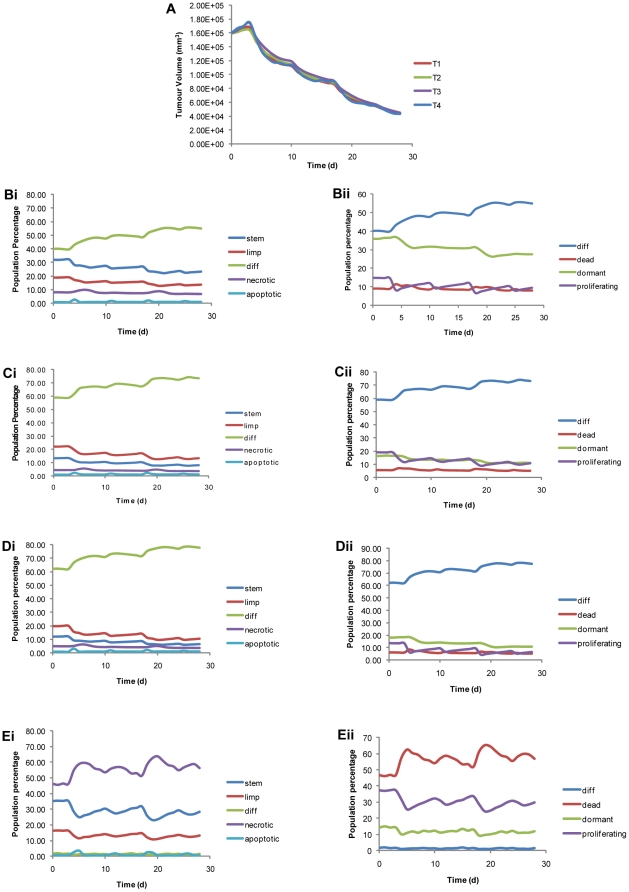
Figure 5. Time evolution of tumor volume and selected tumor subpopulations.
Panel A: Time evolution of tumor volume for the four virtual scenarios of Table 1. Panels Bi and Bii, Ci and Cii, Di and Dii, Ei and Eii: Evolution over time of selected subpopulations of the tumors. The chemotherapeutic scheme of Figure 2 has been simulated. The drug administration instants are: day 3, day 10, day 17, day 24. Day 0: first MRI data set. Day 28: second MRI data set.

