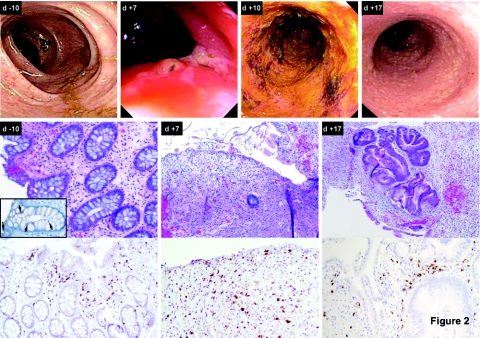
Figure 2.
Sequential colonoscopy findings for patient 2 during treatment. Top row: sequential images from colonoscopies performed prior to treatment (d-10) as well as 7, 10, and 17 days post-treatment. Middle row: hematoxylin and eosin staining of consecutive colon biopsies obtained prior to treatment (d-10) as well as 7 and 17 days post-treatment. The inset in the first panel shows staining of the pretreatment biopsy with a monoclonal antibody against carcinoembryonic antigen, and arrows indicate positive expression. Bottom row: staining of consecutive colon biopsies obtained prior to treatment (d-10) as well as 7 and 17 days post-treatment with a monoclonal antibody against human CD3.

