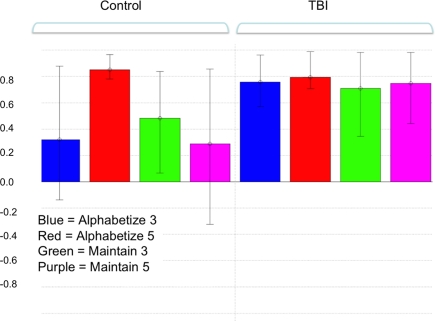
Figure 1.
Pattern of brain and behavioral correlations for the first latent variable (LV) in the combined group analysis. This LV accounted for the greatest magnitude of matrix variance (LV 1, p < 0.01). Colored bars denote the extent to which the experimental conditions relate to the differences in voxel signals represented in the LV (i.e., the design saliences). Error bars denote confidence intervals defined by the standard error of the bootstrap estimates. Error bars crossing zero reflect a non-significant contribution of that experimental condition to the LV pattern. Significant voxel clusters associated with this LV are presented in Table 1.

