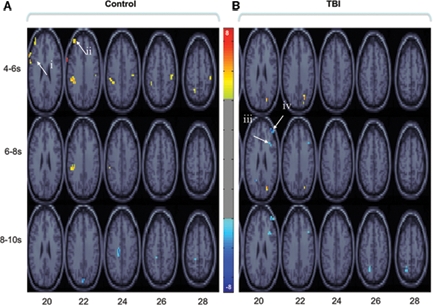
Figure 2.

Brain regions showing significant salience for the first LV in each group-wise bPLS analyses [i. e., those brain regions demonstrating positive correlations between brain response and task accuracy in control (A) and TBI (B) groups for all tasks]. Voxel salience reliabilities were determined by bootstrap ratios (BSR; range is indicated by the color bar). For these images BSR was set at 4 (p < 10−4, corresponding approximately to a p < 0.0001) and cluster size was >10 voxels. Roman numerals indicate PFC regions with the most reliable and positive brain and behavior correlations across all tasks. Talairach coordinates (x, y, z) of cluster maxima: (i) left inferior frontal gyrus (GFi: −67, 9, 29); (ii) left middle frontal gyri (GFm: −40, 48, 23);(iii) right posterior middle frontal gyrus (pGFm: 36, 21, 25); (iv) right anterior middle frontal gyrus (aGFm: 40, 47, 16). These voxels are used asseed regions in subsequent seed and behavior PLS analyses (see textand Figures 3 and 4).
