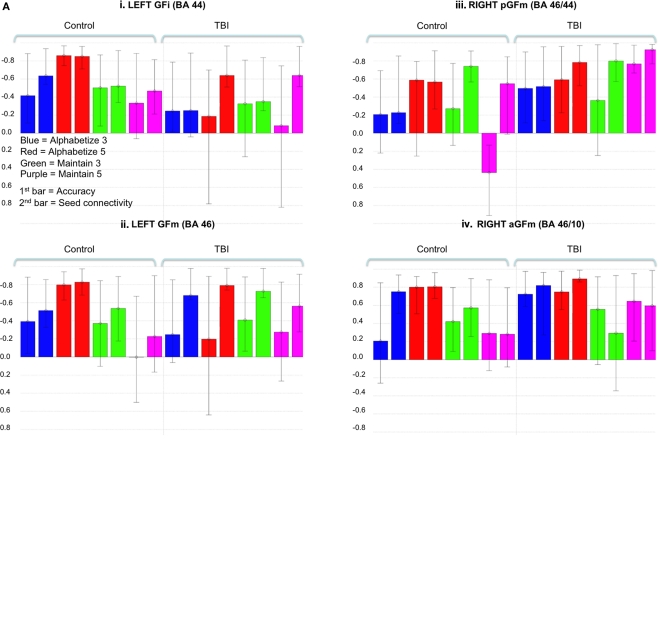
Figure 3.
(A) Behavioral and seed LVs (LV 1 all analyses) for the four PFC ROIs indicated in Figure 2. Legend in (Ai) applies to all histograms. For consistency of presentation, correlation values are reversed on the x-axis for (Ai–iii). Significant brain saliences for these LVs were negative (B), thus indicating a positive behavior and seed correlation. Error bars represent confidence intervals defined by the standard error of the bootstrap estimates (as in Figure 1). (B) BSRs for each of the LVs represented in (A). Slice coordinate in Talairach space (z) are indicated in bottom-left (step = 2). Time lags (either 2–4 or 4–6 s post stimulus onset) are indicated on the left of the images. BSR was set at 4 (p < 10−4, corresponding approximately to a p < 0.0001) and cluster size was >5 voxels for all images. As noted above, the sign of the correlation and voxel saliences was reversed between images (Ai–iv). This is reflected in the voxel color coding in (Aiv). However, this does not affect interpretation; all brain–behavior correlations were positive.

