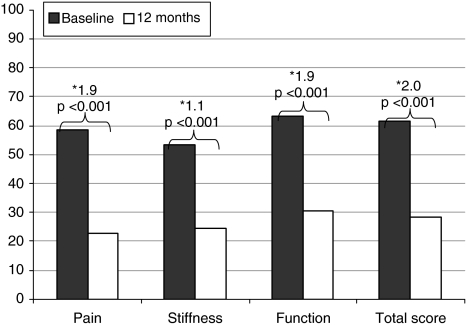
Fig. 1.
WOMAC dimension scores at baseline and 12 months after TKA are shown. The three WOMAC scales were normalized to a 0 to 100 scale for each separate WOMAC dimension, where 0 represents the best health status and 100 the worse health status. *Effect size; WOMAC: Western Ontario and McMaster Universities Osteoarthritis Index.

