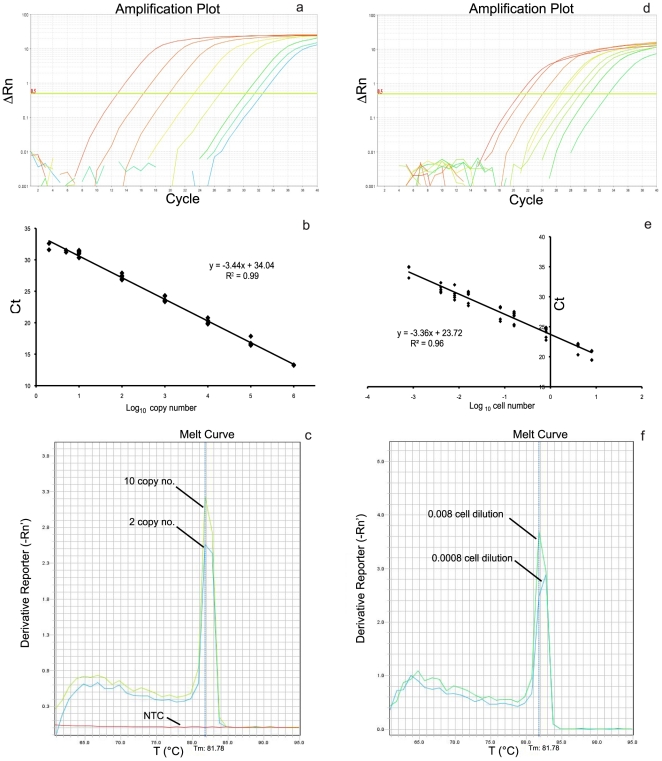
Figure 1. Dynamic range, sensitivity and specificity of the qrt-PCR assay.
A typical amplification plot (a, d) and the corresponding standard curve (b, e) for the pLSUO and gold standards are shown, respectively. A 204 bp fragment of the LSU gene were amplified in a 106, 105, 104, 103, 102, 10, 5 and 2 copy dilutions of the pLSUO plasmid (a) and in a 8, 4, 0.8, 0.16, 0.08, 0.016, 0.008, 0.004 and 0.0008 O. cf. ovata cell dilutions (d) of the lysed pool from macroalgae samples. The fluorescence intensity (ΔRn) expressed as logarithmic scale is plotted vs cycle number. Only one replicate is shown. The mean standard curve is obtained by the correlation of Ct values and log10 input plasmid copy (b) or environmental O. cf. ovata cell number (e) measured in 8 independent experiments ± SD, respectively. Melting curve of the the 204 bp amplified fragments of the pLSUO plasmid (c) and environmental O. cf. ovata cells (f) generated by qrt-PCR. To better display the melting curves, only the low input pLSUO plasmid copy number (10, 2 and NTC ) and cell number (0.008 and 0.0008) are shown. As few as two copies of pLSUO plasmid and 0.0008 cell dilutions are clearly detected. The specificity of the 204 bp amplicon was also confirmed by gel electrophoresis and sequencing analysis (data not shown).

