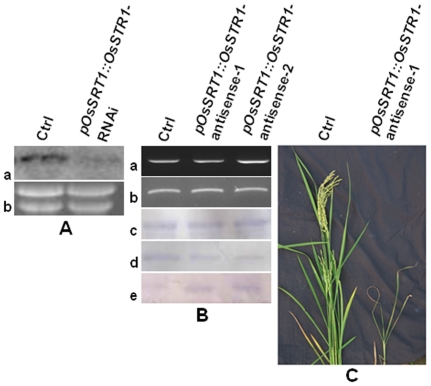
Figure 3. Phenotypic, molecular, and biochemical analyses of primary OsSRT1 antisense transgenic lines.
A. RNA blot analysis of the OsSRT1 transcript. Twenty µg of total RNAs isolated from calli derived from the control rice plant (Ctrl) and hygromycin-resistant calli transformed with the pOsSRT1::OsSRT1-RNAi transgene were separated on denaturing agarose gel, stained with ethidium bromide, transferred to a nylon membrane, hybridized with α-32P-labeled OsSRT1 cDNA fragment, and analyzed by autoradiography(a). The lower panel shows the ethidium bromide-stained ribosomal RNAs used as a loading control (b). B. The expression of the pOsSRT1::OsSRT1-antisense transgene had no effect on the OsSRT1 mRNA level but significantly reduced the OsSRT1 protein abundance. pOsSRT1::OsSRT1-antisense-1 and -2 are two independent OsSRT1-antisense transgenic lines. a) RT-PCR analysis of the transcript abundance of the endogenous OsSRT1 gene (see Materials and Methods for experimental details). b) β-actin was used as a loading control. c–e) Immunoblot analysis of the protein abundance of Tubulin (c), OsSRT1(d), and the level of H3K9 acetylation(e). Equal amounts of protein crude extracts were separated by SDS-polyacrylamide gel electrophoresis, transferred to nitrocellulose filters, and analyzed by immunoblotting with antibodies against Tubulin (for loading control), OsSRT1, and acetylated Lys-9 residue of histone 3 (H3K9). C. Phenotypic comparison between a representative pOsSRT1::OsSRT1 antisense transgenic line (1) and a wild-type control (Ctrl).

