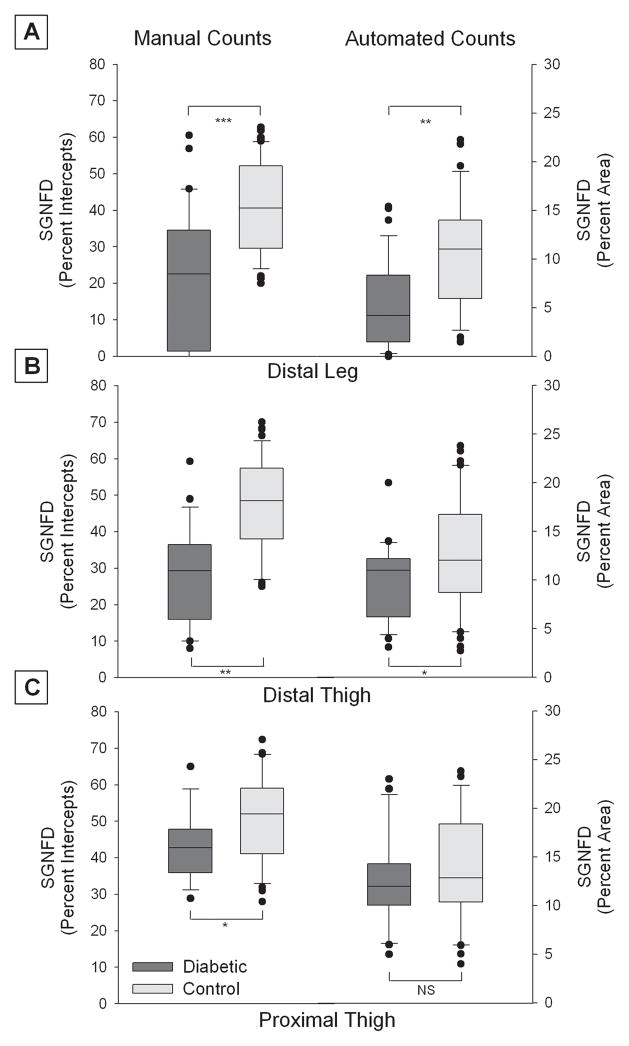
Figure 3. Sweat gland nerve fiber density (SGNFD) by location in control and diabetic subjects.
The results of the automated counting method and the manual counting methods are shown at the distal leg (A), distal thigh (B) and proximal thigh (C). The manual count values are denoted on the left Y axis (expressed as intercept density) and the automated count values by the right Y axis (expressed as percent area). Diabetic subjects are denoted by the dark box plots and healthy controls by the clear box plots. The box plots demonstrate the median value, with first and third quartiles outlined by the box, tenth and ninetieth percentiles by the whisker lines and individual outliers shown as solid dots. *** P<0.001, ** P<0.01, * P<0.05, NS = non significant.

