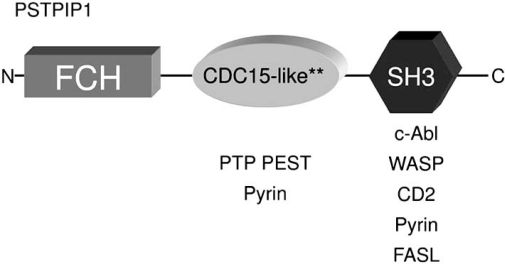
Fig. (2).
PSTPIP1 protein schematic. FCH, coiled-coil, and SH3 domains are shown. Asterisks denote the relative positions of the A230T and E250Q mutations. Interacting proteins are shown below single domains for simplicity. It should be noted that some in vitro studies indicate more complex binding patterns than depicted here.

