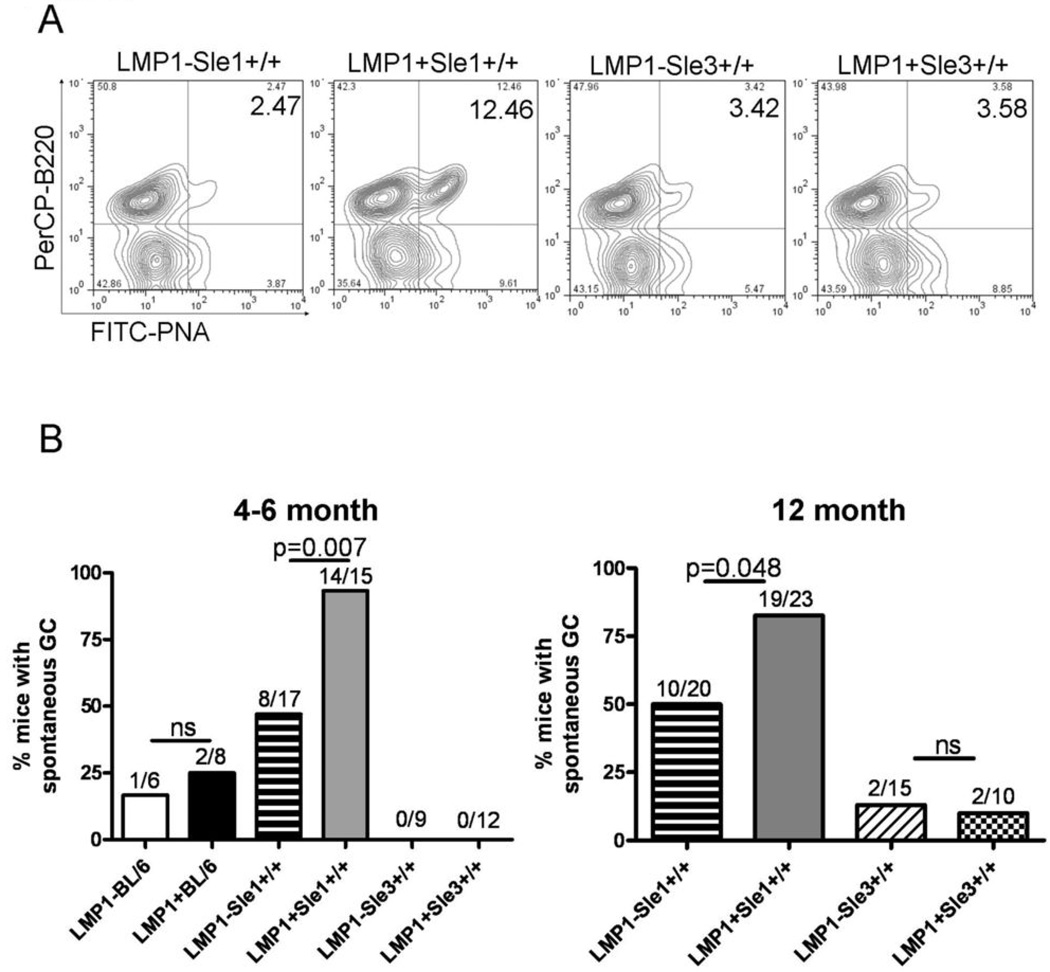
Figure 2. Frequency of spontaneous GC B cells in LMP1+Sle1+/+ vs. LMP1+Sle3+/+ and non-tg LM mice.
A. RBC-depleted splenocytes from unimmunized 4–6 month old female LMP1+Sle1+/+, LMP1+Sle3+/+, and non-tg LM mice were stained with PNA and anti-B220 to identify spontaneous GC B cells by flow cytometry after gating out dead cells. Representative flow cytometry plots are shown.
B. Composite data showing the percentage of 4–6 month old female (left panel) and 12 month old male and female (right panel) LMP1+Sle1+/+ mice with elevated spontaneous %GC B cells, compared to LMP1+Sle3+/+, LMP1+BL/6, and non-tg LM. A mouse was considered to have elevated %GC B cells if the frequency was larger than the LMP1−Sle3+/+ mice analyzed in the same experiment. The numbers above each column represent the number of mice of each genotype with elevated %GC B cells out of all mice analyzed. p-values were determined by Chi-square test; ns=not significant.

