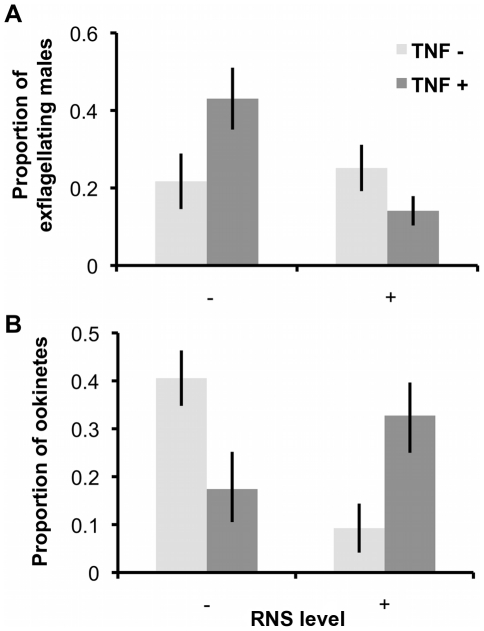
Figure 3. Exflagellation rates and ookinete production after exposure to RNS and TNF-α during gametogenesis.
Mean (± S.E.) proportion of exflagellating male gametes (A; n = 16) or ookinetes (B; n = 9) produced when parasites are exposed to RNS and TNF-α during gametogenesis (in-vector conditions media). Proportions are relative to the total number of exflagellating male gametes or ookinetes produced from each infection, across treatments.

