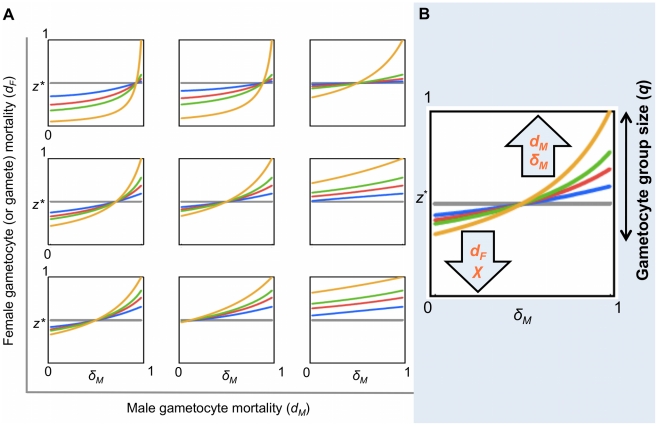
Figure 5. Evolutionarily stable sex allocation strategies when sex- and stage-specific mortality rates vary.
Effect of male and female gametocyte mortality and male gamete mortality on the ES gametocyte sex ratio (z*), for a clonal population, when the number of gametes produced per male gametocyte (χ) is 2 (this fecundity has been estimated for this system by other studies; see ref. [19]). Figures S1, S2, S3 show similar patterns to Figure 5A for χ = 1; 4; 8, respectively. (A) For each plot within the panel, z* varies with male gamete mortality rate (δM). The coloured lines represent different gametocyte group sizes (q): 2 (grey), 5 (blue), 10 (red), 20 (green) and ∞ (yellow). Each plot depicts different parameter combinations of male gametocyte (dM = 0.1; 0.5; 0.9) and female mortality rate (dF = 0.1; 0.5; 0.9), with dM increasing left to right and dF increasing bottom to top. (B) Cartoon summarizing the effects observed in Figures 5A and S1, S2, S3. The set of possible values for z* is strongly influenced by q. The number of gametes of each sex reaching the mating pool (which depends on the mortality parameters and on χ) influences z* within the constraints determined by q. Within each plot, the effects of δM and q on z* can be clearly observed: the magnitude of sex ratio change increases with q and z* increases to compensate for higher δM. The effects of dM and dF can be observed by comparing the points where the lines cross the y axes (i.e. δM = 0) across the plots: z* increases along rows with increasing dM and decreases up the columns with increasing dF. The effect of χ on z* can be observed by comparing plots that are in the same position in different figures: sex ratio becomes more female biased as χ increases.

