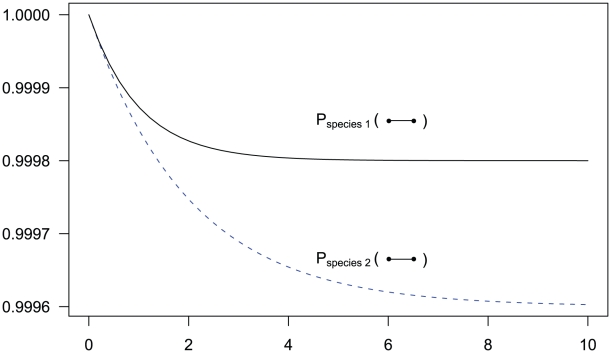
Figure 3. State probabilities for the single sequence two-nucleotide coalescent process as a function of time.
The figure shows the probability of the two neighboring nucleotides being linked in the single-sequence CTMC and how this probability evolves over time. The probability for being unlinked is, of course, one minus the probability of being linked, since the CTMC has only two states. The two different lines correspond to two different coalescence rates. For population 1, the coalescence rate is set to 1 (so the x-axis is in units of  generations for this species), while for population 2 the coalescence rate is half that, corresponding to population 2 having twice the effective population size of population 1. The recombination rate is set to
  . Assuming
  of 20,000 for population 1 and 40,000 for population 2, and a generation time of 20 years, this corresponds to 1 cM/Mbp and 1 unit on the x-axis corresponds to 400,000 years. The separation time we infer for the orangutan sub-species is around
  on the x-axis, where the system is still far from equilibrium.

