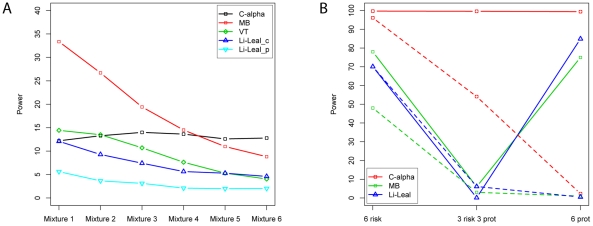
Figure 3. Power comparisons and variants.
(A) shows power comparisons for the population genetics model simulations. Power comparisons are for C-alpha, Madsen-Browning (MB), Variable threshold (VT), and Li-Leal's approach (presence/absence Li-Leal_p and count of rare variants Li-Leal_c). These simulations reflect the presence of selection on the variation which predisposes to phenotype. As we increase the mixing proportions between risk and protective variants (moving from mixtures 1 to 6, which reflects 0, 10, 20, 30, 40 and 50% chance of any of the phenotypically relevant variants are protective, rather than risk), C-alpha maintains power, while other tests lose power. In (B), the each of 6 variants explains 0.1% of the variance of the phenotype. All three approaches have high power when all the effects are detrimental. For burden tests, the power drops markedly when 3 variants are protective and 3 are detrimental. “Selected” controls are chosen from the lower 1% of the liability distribution. The solid (dashed) lines represent power for selected (unselected) controls.

