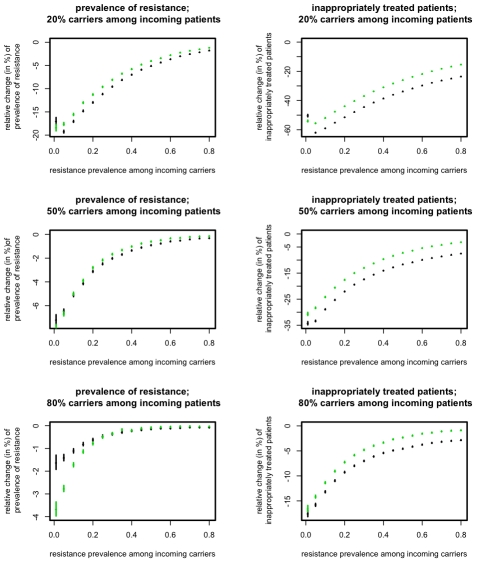
Figure 4. Relative change of resistance prevalence(left column) and inappropriately treated patients (right column) compared to mixing for ISS7 (green points) and ISSLast (black points).
The figures show the change induced by ISS7 and ISSLast as a function of the resistance prevalence among incoming carriers, pA0+p0B, (x-axes) and for different fractions of carriers, pC, among incoming patients (rows). Points correspond to the mean over 104 simulations, error-bars correspond to the 95% confidence interval of the mean, inferred through 1000 bootstrap samples.

