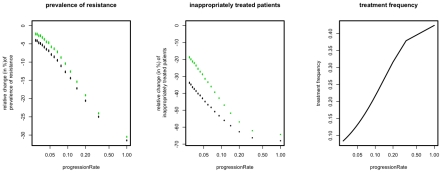
Figure 5. Relative change of resistance prevalence and inappropriately treated patients compared to mixing for ISS7 (green points) and ISSLast (black points).
The figures show the change induced by ISS7 and ISSLast as a function of the rate of progression, rP, (x-axes). The right panel shows how treatment frequency increases as a function of the rP. Points correspond to the mean over 104 simulations, error-bars correspond to the 95% confidence interval of the mean, inferred through 1000 bootstrap samples.

