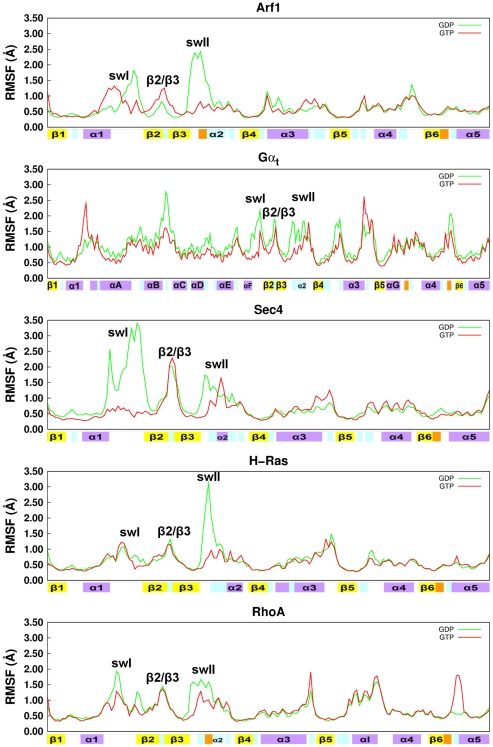
Figure 3. RMSF profile from MD trajectories of the SGDP and SGTP forms of the five Ras GTPases.
Green and red lines refer to the SGDP and SGTP forms, respectively, of Arf1, Gαt, Sec4, H-Ras, and RhoA. RMSF profiles refer to the 40000 frames constituting 40 ns trajectories. The secondary structure elements are shown on the abscissa, following nomenclature and color code described in Figure 1.

