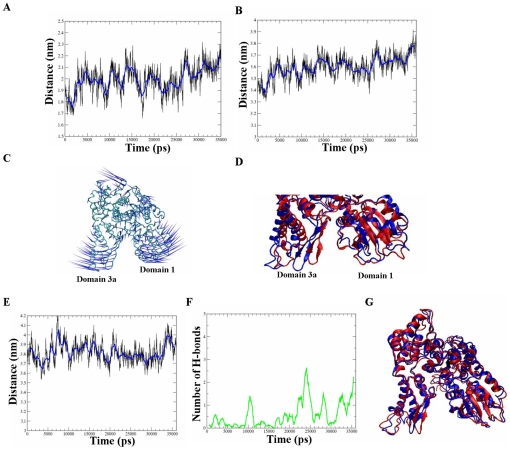
Figure 8. Back-mutations in munc18a restore its dynamic nature and induce gradual reopening of its cavity.
A) Measurement of the distance between the centers of mass of domains 3a and 1 during back-mutated wild-type munc18a simulation (munc18aD306S,D313S, 36 ns). B) The distance of the centers of mass of two regions adjacent to the cavity: residues 35–70 (domain 1) and residues 260–280 (domain 3a). C) Porcupine plot demonstrating the opening motion of the cavity (the fourth most dominant eigenvector of the protein in the simulation). D) Superposition of domains 3a and 1 from the last frames in the simulations of munc18aS306D,S313D (t = 35 ns, red) and munc18aD306S,D313S (t = 36 ns, blue). E) Measurement of the distance between the centers of mass of domains 3a and 1 during the munc18aS306A,S313A simulation (36 ns). F) Time-dependent change in the number of hydrogen bonds between domains 3a and 1 in the munc18aS306A,S313A simulation G) Superposition of the structure of munc18aS306A,S313A in the first (t = 0, red) and last frame (t = 36 ns, blue) of the simulation.

