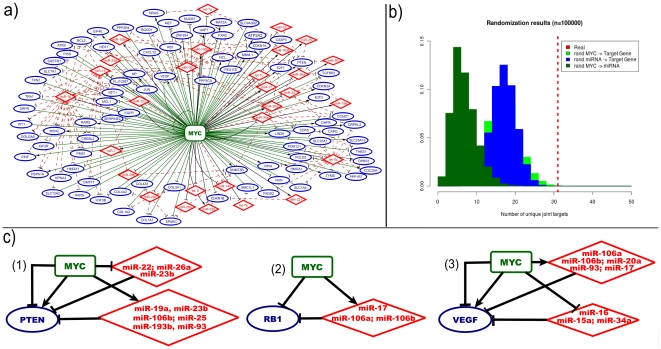
Figure 2. Properties of the mixed FFLs.
a) Graphical representation of the network obtained combining together all the MYC-centred mixed FFLs. MYC is depicted in green, nodes in red (diamonds) correspond to miRNAs, whereas the blue ones (ellipses) correspond to Joint Targets. Biological relationship between two nodes is represented as an edge (edges in green identify targets regulation by Myc, black edges evidence the miRNAs regulation by Myc and in red the targets regulated by miRNAs). b) Randomization results for the over-representation analysis of Myc induced mixed FFLs validated with low throughput experiments. We plotted the number of Joint Target genes obtained in the real Myc network, alongside the distributions (normalized histograms) of the number of Joint Target genes detected in the three randomization strategies adopted c) A few interesting examples of FFLs, having as Joint Target: (1)PTEN, (2)RB1 and (3)VEGF.

