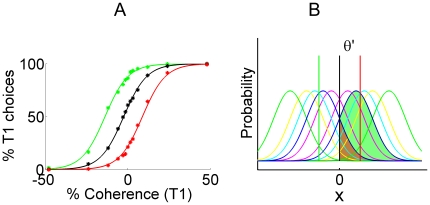
Figure 1. Choice behavior with unbalanced rewards and an account in signal detection theory.
A: Response probabilities in a perceptual decision-making task [14] with reward manipulations. Data from one of two monkeys in [14] have been replotted with permission from the authors. Percentage of positive direction choices (denoted  in the figure) increases with motion coherence in the positive direction in a sigmoidal fashion; one direction of motion is nominally defined as positive, the other as negative. Black: balanced reward condition; Green: reward is higher in the positive direction; Red: reward is higher in the negative direction. Dots represent data in [14] and solid curves represent fits based on signal detection theory (SDT) as depicted in panel B. B: a characterization of this choice behavior based on SDT. Gaussian functions in different colors indicate the distribution of the evidence variable
  arising in each of the different coherence conditions. Vertical lines indicate the relative positions of the decision criterion. Black, green and red vertical lines represent the criterion positions for the balanced, positive, and negative reward conditions respectively. The area to the right of a specific criterion under a specific distribution corresponds to the percentage of positive choices in that reward and coherence condition. As examples, the areas associated with balanced reward, and coherences
 (blue curves) are shaded.

