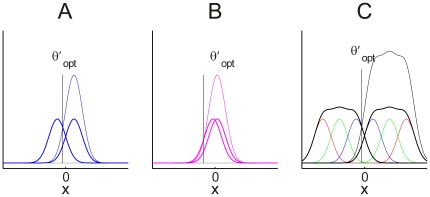
Figure 2. Optimal reward bias for relatively high (panel A), low (B) and combined (C) stimulus levels.
A and B: When there is only one stimulus level, the optimal decision criterion is at the point where the distributions intersect after scaling their relative heights by the corresponding reward amounts. The amount of reward bias is smaller when the sensitivity is higher (panel A), and greater when the sensitivity is lower (panel B). C: When multiple stimulus levels are employed, the optimal criterion lies at the intersection of the summed distributions multiplied by the corresponding reward amounts.

