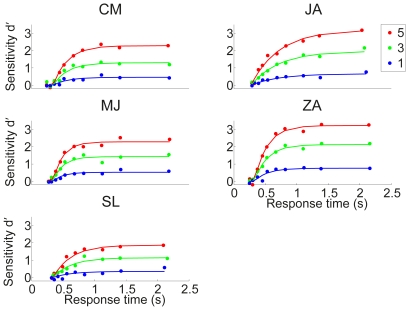
Figure 4. Stimulus sensitivity follows a shifted exponential approach to asymptote as processing time increases.
Colors code the three discriminability levels: red, green and blue for  and
and  pixel(s) difference respectively. Symbols denote data (see text for details) and solid curves denote the delayed exponential fit.

