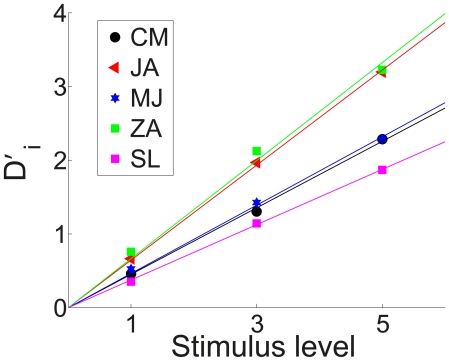
Figure 5. Asymptotic sensitivity scales approximately linearly with stimulus level.
Symbols denote the asymptotic sensitivity as in Figure 4 and Table 1; Solid lines denote the linear fit constrained to go through the origin. Fitted values of the scalar  are
are  respectively for participants CM, JA, MJ, ZA and SL.

