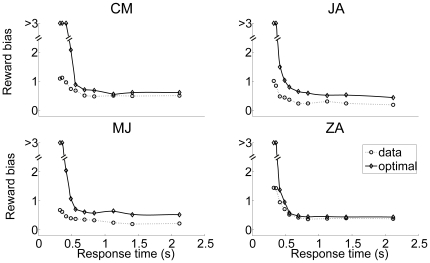
Figure 6. Reward bias is sub-optimal, especially at short delays.
The observed reward bias,  (open circles connected with dotted lines) is put together with the optimal bias
  (diamonds with solid curves). Individual panels represent the individual results of the four participants showing a reward bias.

