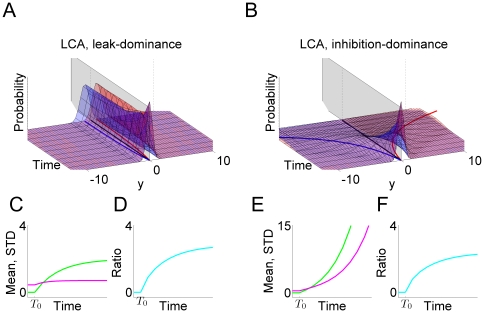
Figure 7. Time evolution of the activation difference variable  in the reduced leaky competing accumulator model.
Top panels: probability density functions of the activation difference variable in leak- (panel A) and inhibition-dominance (panel B). See text for details. At a given time point, the variable is described by a Gaussian distribution (red distribution for a positive stimulus condition and blue for the corresponding negative stimulus). The center position of each distribution (red and blue solid lines on the bottom) represents the mean of the activation difference variable  and each distribution's width represents the standard deviation
  . As time goes on, the two distributions broaden and diverge following the dynamics in Equation (7). The distance between them normalized by their width correspond to the stimulus sensitivity
  , which uniquely determines response probabilities when the decision criterion is zero (vertical black plane). In leak-dominance, the distance between the two distributions and their width (green and magenta lines respectively in panel C) both level off at asymptotic values. In contrast, they both explode in inhibition-dominance (panel E). However, the ratio between the two behaves in the same way (panel D and F). Note: In panels C–F, the
  point on the x-axis corresponds to the time at which the stimulus information first begins to affect the accumulators. The flat portion of each curve before that time simply illustrates the starting value at time
  .
.

