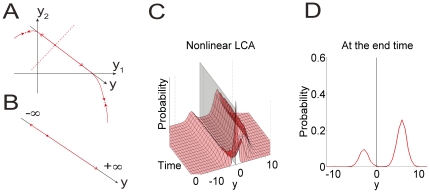
Figure 8. Effect of nonlinearity on the dynamics of the activation difference variable and on response probabilities.
Only the case of a positive stimulus is drawn. Left column: phase planes of the full nonlinear leaky competing accumulator model (panel A) and the linear O-U approximation (panel B). In panel A, a point on the  plane represents the two activation variables whose values are read out from the horizonal and vertical axes. The time evolution of the two variables is described by the trace of the point. They explode first until they are out of the first quadrant and then converge to one of the two attracting equilibria. In panel B, the activation difference variable
  explodes to either
  or
or  . The dashed line in panel A denotes the boundary of the basins of attraction. In the one-dimensional space in panel B, the boundary is denoted by the red dot. Panel C: the probability density function (PDF) of
  based on the full nonlinear LCA. Panel format is as in Figure 7. Panel D: the PDF at the end of the time interval simulated.

