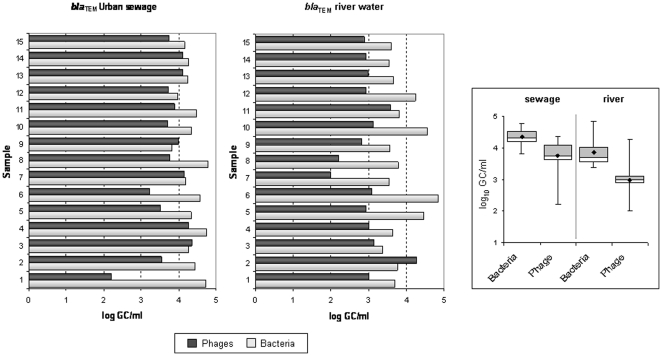
Figure 2. Number of copies of bla TEM genes (GC/ml) in urban sewage and river water samples in phage and bacterial DNA.
On the left side of the figure, bar chart of the gene copies detected for each sample, dark grey for phage DNA and light grey for bacterial DNA. On the right side of the figure, the box plot chart shows the averaged values obtained from all samples from the same origin. Within the box plot chart, the cross-pieces of each box plot represent (from top to bottom) maximum, upper-quartile, median (black bar), lower-quartile, and minimum values. Black diamond shows the mean value. The grey boxes in the box plot chart include samples showing values within the 75th percentile and white boxes samples showing values within the within the 25th percentile.

