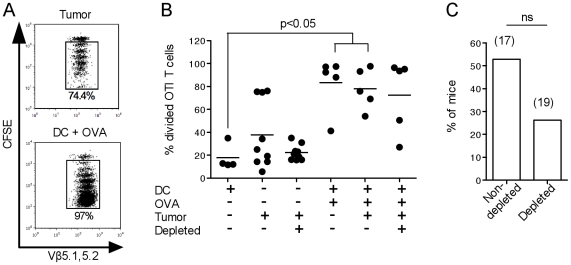
Figure 4. Treg depletion does not affect the proliferation of tumor-specific T cells in vivo.
C57BL/6 mice were treated with PC61 or left untreated, and injected with B16.OVA s.c. After 13–16 days each mouse was injected with 1.5×10⁶ naïve, CFSE-labeled OTI T cells. LN were removed 3 days later and OTI T cell proliferation was determined by flow cytometry. (A) Representative dot plots of proliferating OTI T cells in the draining LN of tumor-bearing mice (top panel) or non tumor-bearing mice immunized with OVA257–264 -loaded DC (bottom panel). The percent divided cells is shown. (B) Division of OTI T cells in LN draining the tumor or DC immunization site. Where both tumor and DC were given, the LN draining the immunization site was examined. Horizontal lines show the average percentages of divided cells. The graph is representative of 4 independent experiments with 5–10 mice per group per experiment. (C) Percentage of mice showing OTI T cell proliferation in the tumor-draining LN. The total number of mice (n) in each group is shown. Data are compiled from 3 separate experiments; ns, not significant by a Fisher's exact probability test.

