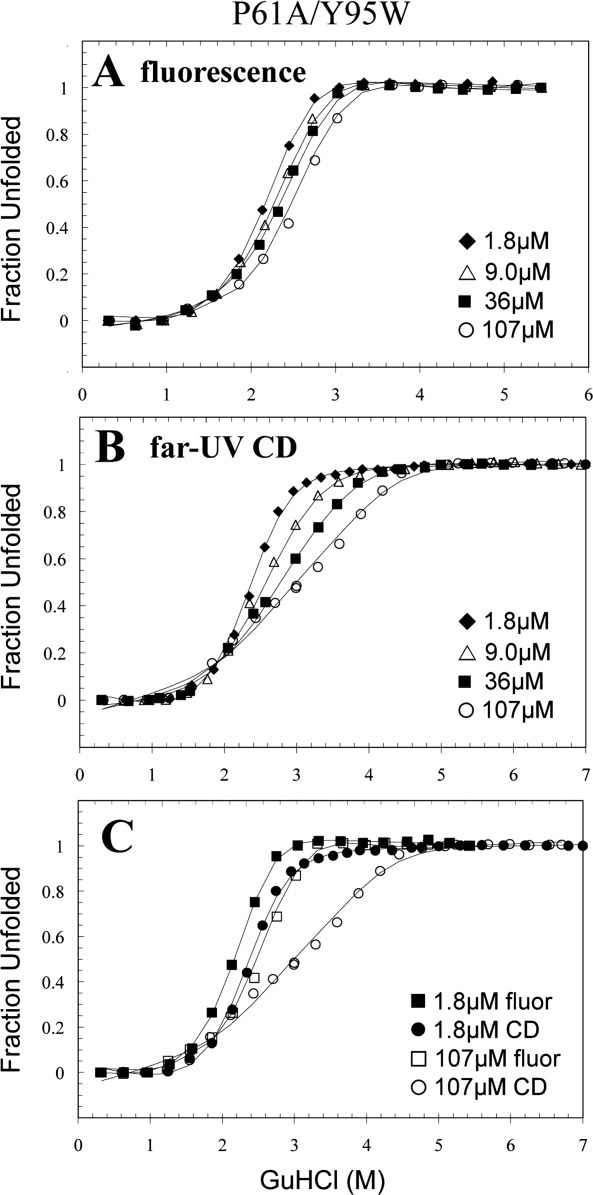
Figure. 5.

Representative GuHCl-induced denaturation data of P61A/Y95W FIS monitored by fluorescence (A) and far-UV CD (B). An overlay of the highest and lowest concentration used in both methods are shown in (C). The solid line curve fits were generated by global fitting the data using Excel and are based on the N2 ⇆ I2 ⇆ 2U denaturation mechanism (Table I). The data are displayed as fraction unfolded, which is defined by Eq. (2). These denaturation experiments were all performed in 10 mM PB at pH 7.4 with 0.1M NaCl at 20°C.
