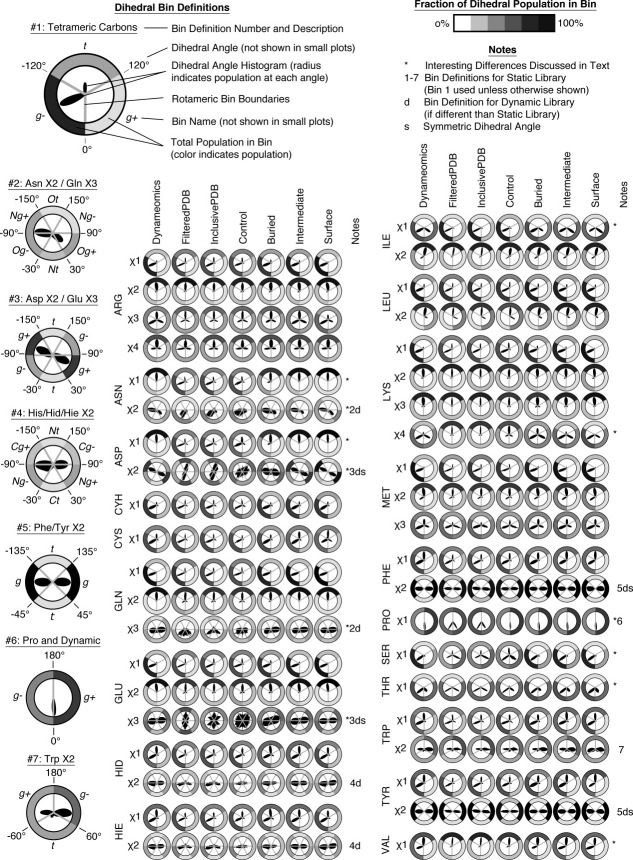
Figure. 2.
Polar Dihedrals and Dihedral Angle Bins. For each data set, amino acid, and dihedral angle, a polar plot of the dihedral angle histogram is displayed (as in Fig. 1), the division of that dihedral angle into rotameric bins, and the total population of each bin. The left-hand column shows the rotameric bin definitions used; the first definition additionally contains a graphical legend of the components of each plot. The notes column draws attention to dihedral angles with significant differences between Dynameomics and experimental datasets with an asterisk and specifies that bin definitions were used for each dihedral angle, which angles required a different definition for dynamic analyses, and which angles are symmetric.

