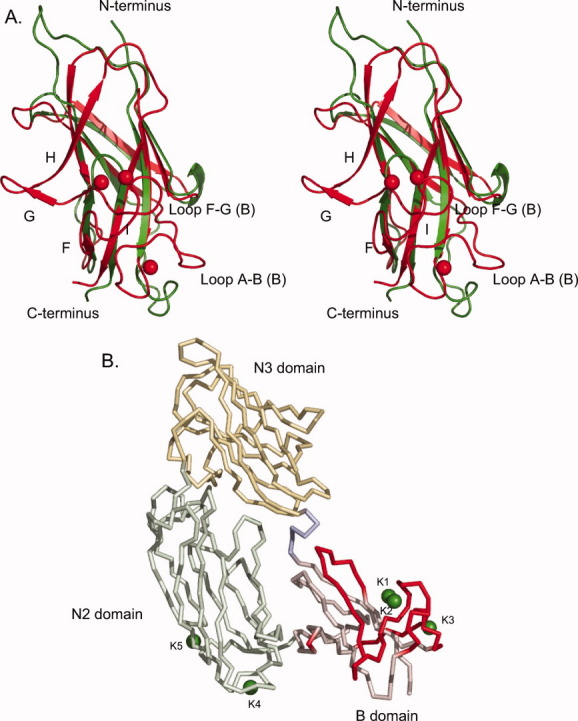
Figure. 5.

Structure comparison of the B domain of UafA with that of CNA. (A) Stereo diagram of the B domain of UafA superposed onto that of CNA. Gly694–Asp809 of UafA (red) and Ser538–Thr623 of CNA (green) are superposed. Potassium ions bound in the B domain of UafA are also shown as red balls. (B) Residues absent in CNA or of which Cα are more than 4 Å apart from the position of the corresponding residue in CNA are shown in red. The bound potassium atoms are also shown as green balls.
