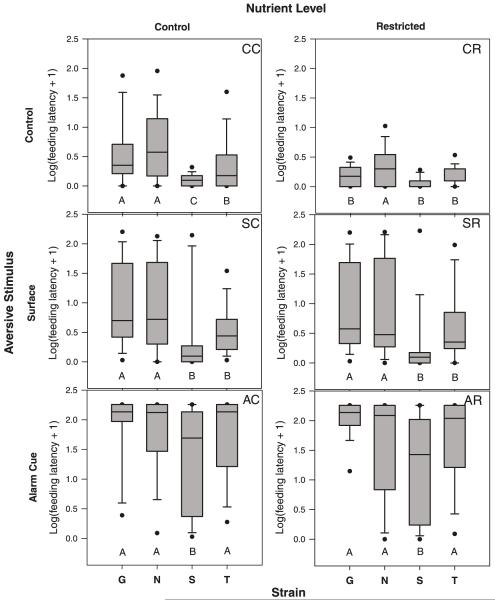
Fig. 2.
Boxplots of feeding latency during nutrient and risk-cue manipulation in four zebrafish (Danio rerio) strains (G, Gaighatta; N, Nadia; S, Scientific Hatcheries; T, TM1). Log-transformed data are shown to facilitate comparisons of the alarm-cue treatments with other treatments. Different letters along the x axis within each plot denote significant differences (p < 0.05) among strains. Letters in the upper right-hand corner of each plot represent the abbreviated treatment names from Table 1.

