
. 2011 Feb 20;6:19. doi: 10.1186/1748-717X-6-19
Copyright ©2011 Petsuksiri et al; licensee BioMed Central Ltd.
This is an Open Access article distributed under the terms of the Creative Commons Attribution License (http://creativecommons.org/licenses/by/2.0), which permits unrestricted use, distribution, and reproduction in any medium, provided the original work is properly cited.
Figure 3.
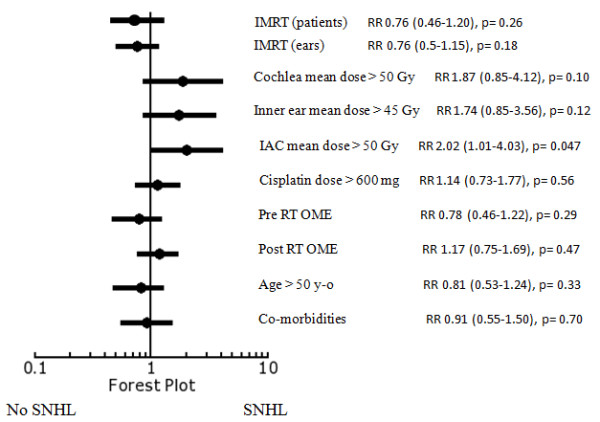
Forest plot for relative risk of SNHL at 4 kHz.