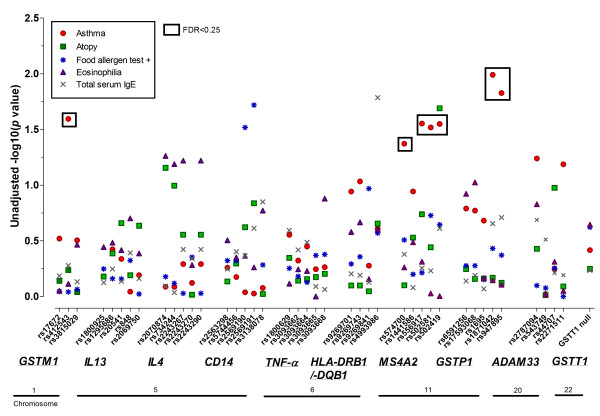
Figure 1.
Segmented Manhattan plot displaying SNP associations with asthma/allergy traits. Negative log-transformed p-value (-log(p)) indicative of statistical significance for the association between each SNP and trait, where higher -log(p) values correspond to greater statistical significance. SNPs significant based on FDR < 0.25 indicated with a black box.

