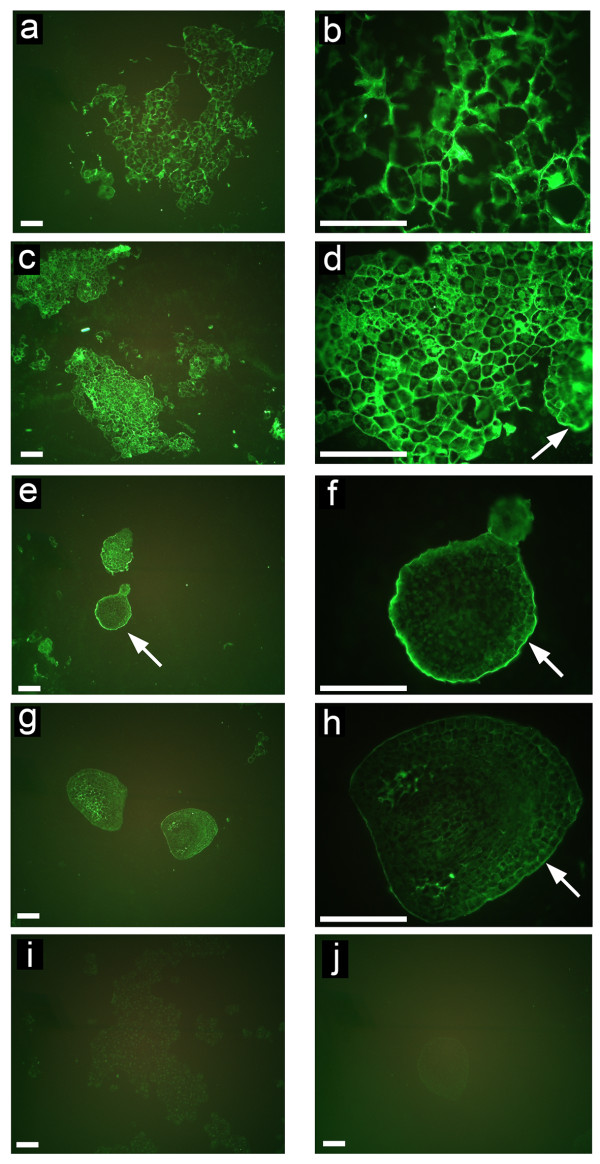
Figure 3.
Developmental immunofluorescence localization of JIM20 epitope during somatic embryogenesis of banana. (a) Nonembryogenic cells. (b) Detailed view from Figure (a), showing strong signal mainly in the cell walls. (c) Embryogenic cells. (d) Detailed view from Figure (c) showing stronger fluorescence, especially in the cell walls and cytoplasm around the nucleus as well as at the surface of cell aggregates (arrow). (e) Proembryos and globular embryos showing very strong surface fluorescence (arrow). (f) Detailed view from Figure (e) showing strong fluorescence in ECM covering epidermal cells (arrow). (g) Embryos at later stages. (h) Detailed view from Figure (g) showing strong signal in the tri-cellular junctions of cortical cells and moderate signal in the ECM at the surface (arrow). (i) and (j) Negative controls (labelled solely with secondary antibody) for non-embryogenic cells (i) and pre-globular embryo (j). Bars, 100 μm.

