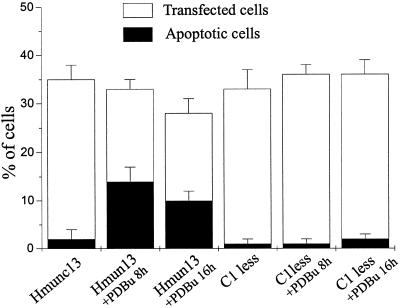
Figure 7.
Graphic representation of the percentage of transfected (immunostaining-positive) and apoptotic (TUNEL-positive) cells in hmunc13-transfected cells or C1-less mutant-transfected (C1 less) cells treated with or without PDBu for 8 or 16 h. Cell numbers were counted with an average of three low-power views under the confocal microscope. Bars are representations of means ± SD of three experiments.

