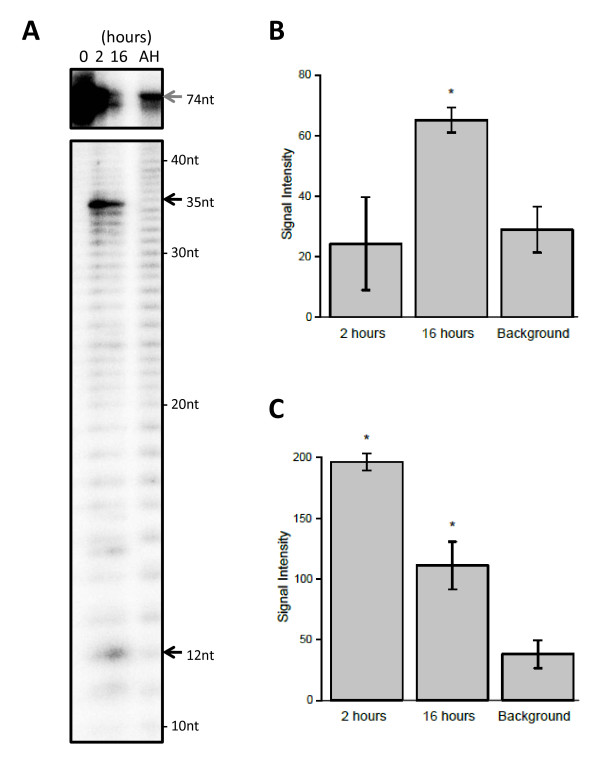
Figure 7.
Two-step processing of the 5'-end labelled pre-mmu-mir-1982 RNA by recombinant DICER protein. (A) In vitro processing of the pre-mmu-mir-1982 RNA by the rDICER protein at a longer incubation time. 5' labelled pre-mmu-mir-1982 RNAs were incubated with rDICER for 0, 2 and 16 hours. The gray arrow shows the band of unprocessed RNA and the black arrow shows the bands of small RNA processed from pre-mmu-mir-1982 RNA. AH: the alkaline hydrolysis ladder of pre-mmu-mir-1982 RNA. The size of each band was determined by the AH ladder. (B-C) The signal intensities were quantified from the 12 nt (B) and 35 nt (C) bands in Figure 7A. These plots show average values bracketed by s.e.m. error bars; calculated from two independent experiments. Background refers to the signal intensity of the same sized band in the AH lane. The p-value was calculated using a simple t-test for each time point (2 hrs and 16 hrs) relative to the background. Significant differences (p < 0.05) in signal intensities are denoted with an asterisk. The significant calculated p-values are as follows: the 12-nt band at 16 hours, p = 0.017; the 35-nt band at 2 hours, p = 0.0073; and the 35-nt band at 16 hours, p = 0.024.

