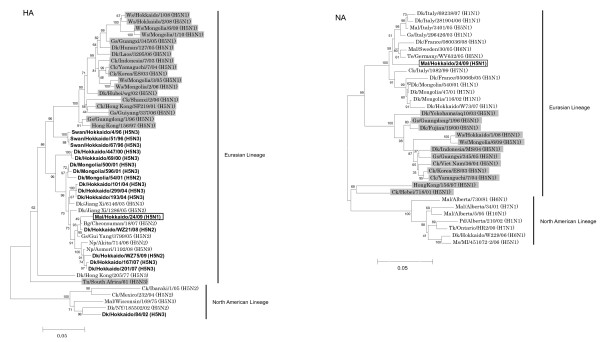
Figure 1.
Phylogenetic trees of the H5 HA and N1 NA genes of influenza viruses. Nucleotides 79 - 1,024 (946 bp) of the HA and 226 - 1,098 (873 bp) of the NA were used for phylogenetic analysis. Horizontal distances are proportional to the minimum number of nucleotide differences required to join nodes and sequences. Digits at the nodes indicate the probability of confidence levels in a bootstrap analysis with 1,000 replications. HPAIVs are highlighted in gray. Mal/Hok/24/09 (H5N1) is shown in the enclosed square. H5 viruses isolated from migratory water birds in the surveillance in autumn between 1996 and 2009 are denoted in bold. Abbreviations: Ws (Whooper swan), Gs (Goose), Dk (Duck), Ck (Chicken), Mal (Mallard), Bg (Bean goose), Np (Northern pintail), Tn (Tern), Gu (Gull), Te (Teal), Ms (Mute swan), Pd (Pintail duck), Tk (Turkey).

