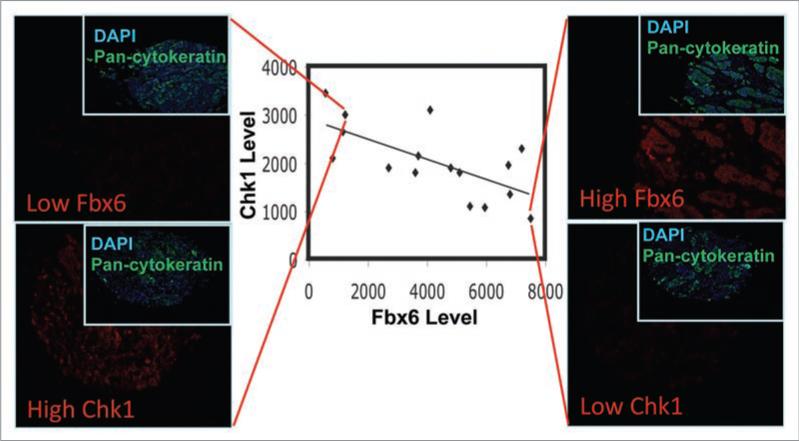
Figure 1.
Inverse correlation between Chk1 and Fbx6 in breast tumors. A panel of 16 breast tumor tissues were analyzed for expression of Fbx6 and Chk1 by quantitative immunostaining using the AQUA™ technology that allows reproducible measurements of proteins of interest in both the cytoplasmic and nuclear compartments of cells in fixed tissues. These tumor samples had not been categorized for cancer sub-type or stage at the time of excision. Expression of Fbx6 and Chk1 was plotted. The linear regression is well fitted, with an R-square of 0.351. The trend line is the result of linear regression between Fbx6 and Chk1 AQUA scores with a Pearson correlation coefficient of R = -0.59 (p = 0.016). Rank order correlation analysis of the data indicates a Spearman rho = -0.556 (p = 0.025). Two tumor staining representing high Chk1/low Fbx6 and low Chk1/high Fbx6 were shown on the left and right, respectively. DAPI and pan-cytokeratin were used to stain the nucleus and cytoplasm, respectively.

