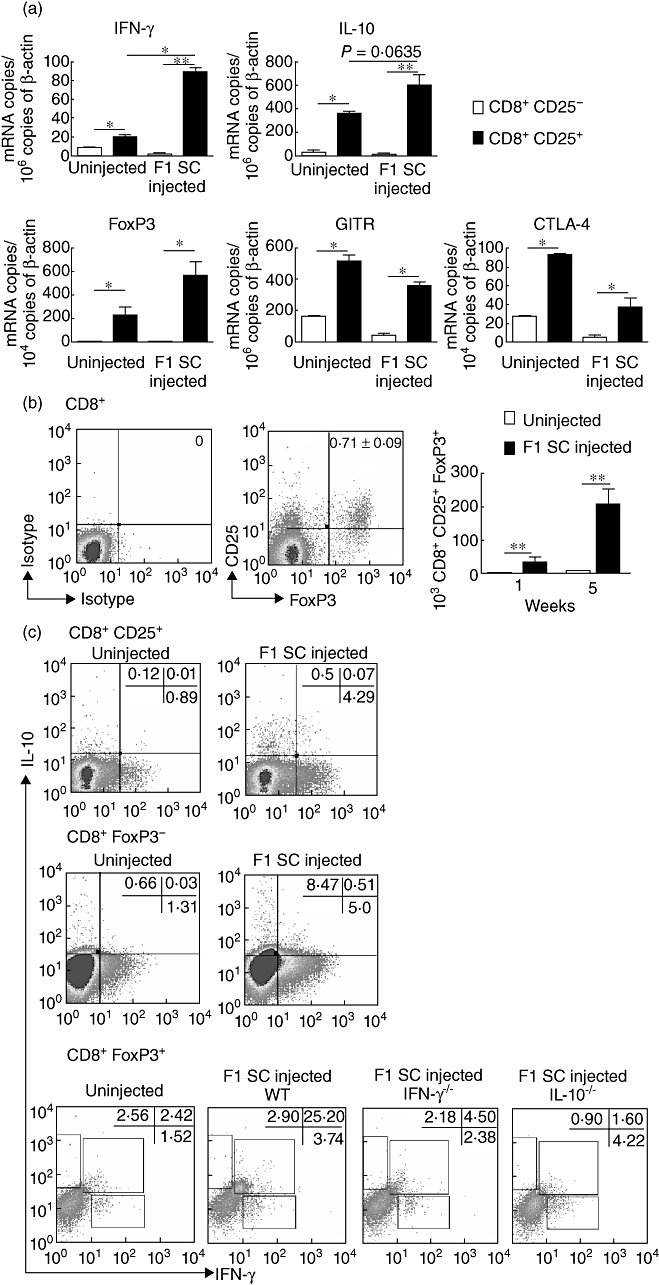
Fig. 2.

CD25 and forkhead box P3 (FoxP3) expression and interferon (IFN)-γ and interleukin (IL)-10 production by CD8+ T cells collected from F1 spleen cells injected mice. (a) mRNA quantification of cytokines and regulatory proteins on cell-sorted CD8+CD25+ T cells and CD8+CD25- T cells isolated from total lymph nodes (LN). Data are mean values normalized using β-actin as reference and are collected from three different experiments involving eight mice per experiment (*P < 0·05; **P < 0·001). (b) Intracytoplasmic staining of FoxP3 and surface expression of CD25 on CD8+ T cells on total LN collected from neonatally injected mice. Results are expressed as mean ± standard error of the mean percentages or absolute numbers of CD8+CD25+FoxP3+ T cells from six separate experiments each involving a pool of five mice (**P < 0·001). (c) Intracytoplasmic staining of IFN-γ and IL-10 on either CD8+CD25+, CD8+FoxP3- or CD8+FoxP3+ T cells from total lymph node cells collected from 6–8-week-old uninjected or neonatally injected wild-type, IFN-γ−/− or IL-10−/− mice. Results are expressed as percentage of positively stained cells and are representative of four separate experiments each involving a pool of four to 12 mice.
