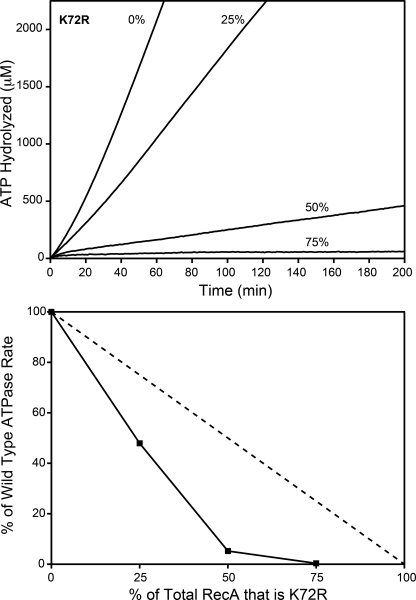
FIGURE 4.
The rate of wild type RecA-catalyzed ATP hydrolysis decreases disproportionately with increasing RecA K72R concentrations. Wild type RecA and RecA K72R were mixed in varying ratios before the addition to cssDNA. The resulting rate of wild type RecA-catalyzed ATP hydrolysis in the presence of RecA K72R was measured as described under “Experimental Procedures.” Reactions contained 4 μm M13mp18 cssDNA, 2 μm total RecA, 3 mm ATP, and 0.4 μm SSB. RecA K72R made up 0, 25, 50, or 75% of the total RecA in each reaction. Upper panel, the concentration of hydrolyzed ATP in μm is plotted versus time in minutes at 0, 25, 50, or 75% RecA K72R. Lower panel, the rate of ATP hydrolysis is plotted as a percentage of the hydrolysis rate at 0% RecA K72R versus the RecA K72R percentage of total RecA. The dashed line represents the percentage of wild type RecA-mediated ATP hydrolysis expected if the rate decreased proportionally to the RecA K72R concentration.

