FIGURE 7.
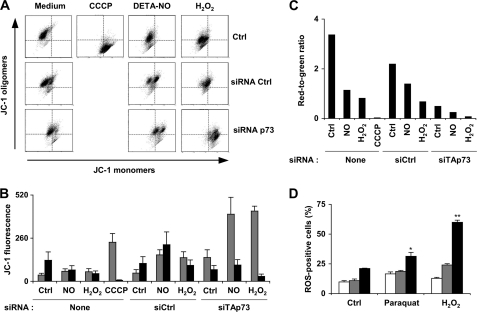
Mitochondrial membrane potential is compromised by knocking down TAp73. A, cells were transfected with 500 nm concentrations of a TAp73 siRNA or a siRNA control (Ctrl). Mitochondrial membrane potential ΔΨm was measured by flow cytometry 48 h later using the JC-1 probe. Some samples were treated by 0.5 mm DETA-NO or 0.1 mm H2O2 during the last 24 h or the last 6 h, respectively. The uncoupling agent carbonyl cyanide p-chlorophenylhydrazone (CCCP) at 50 μm was used as a positive control. Flow cytometry diagrams show the green fluorescent signal of JC-1 monomers in apoptotic cells on the x axis versus the red fluorescent signal of JC-1 oligomers in intact cells on the y axis. B, JC-1 green (gray bars) and red (black bars) fluorescence is shown. siCtrl and siTAp73 refer to a siRNA control and a siRNA against TAp73 mRNA, respectively. Results are the mean ± S.D. of three determinations. C, red-to-green fluorescence ratio was determined from values shown in B. This ratio is proportional to ΔΨm. D, cells were either not transfected (white bars) or transfected with a p53 (gray bars) or a p73 (black bars) siRNA. One day later they were treated with 6 μg/ml paraquat or 0.1 mm H2O2 as indicated. ROS production was analyzed after 24 h by flow cytometry using the H2DCFDA fluorogen. The results shown are the mean ± S.E. of three determinations. p < 0.05 (*) and p < 0.01 (**), compared with untreated and non-transfected cells.

