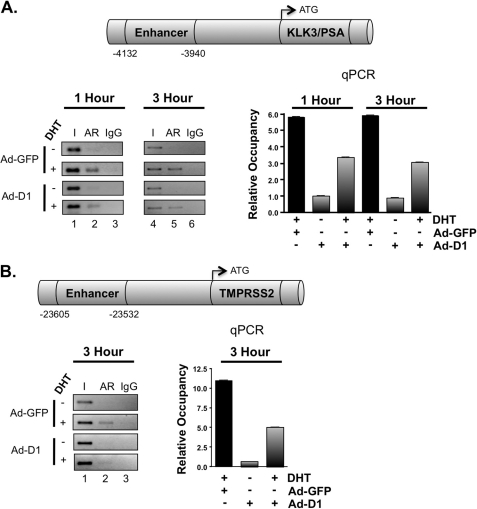
FIGURE 4.
Cyclin D1 displaces AR occupancy at target gene loci. ChIP analysis was performed to determine the influence of cyclin D1 on AR occupancy. LNCaP cells were treated as described in the legend to Fig. 2, except cells were stimulated with 10 nm DHT for 1–3 h. Bar graphs represent the relative occupancy ± S.D. (error bars) from a representative AR ChIP, where each condition is a biological triplicate. A, schematic, KLK3/PSA locus showing the location of the well characterized, AR-responsive enhancer region upstream of the TSS. Bar graph, qPCR analysis for the enhancer region from AR ChIP assays at 1 and 3 h. Representative conventional PCR is provided (left). B, schematic, TMPRSS2 locus showing the location of the AR-responsive enhancer region. Bar graph, qPCR analysis for the enhancer region from an AR ChIP assay at 3 h. Representative conventional PCR is provided (left).

