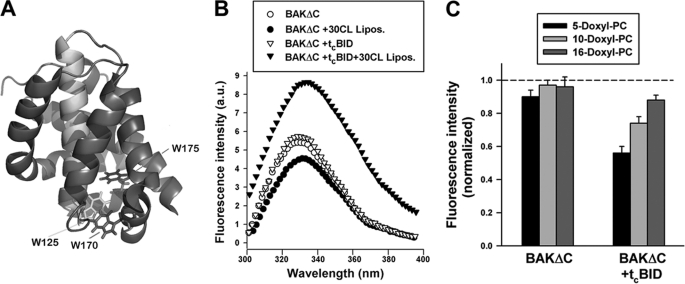
FIGURE 5.
Tryptophan fluorescence analysis of BAKΔC conformation. A, shown is the crystal structure of BAKΔC displaying the tryptophan residues that serve as spectroscopic probes of protein conformational changes in the presence of liposomes. The molecule is colored to highlight the location of W125 in helix 5 (green), W170 in helix 7 (red), and W175 in helix 8 (blue). B, shown are representative tryptophan fluorescence spectra of BAKΔC incubated for 20 min (i) in the absence of LUV (BAKΔC), (ii) in the presence of 25PC/35PE/10PI/30CL LUV (BAKΔC+30CL Lipos.), (iii) in the absence of LUV but with the carboxyl-terminal fragment of caspase-8-cleaved BID (BAKΔC+tcBID), or (iv) in the presence of tcBID and 25PC/35PE/10PI/30CL LUV (BAKΔC+tcBID+30 CL Lipos.). BAKΔC, tcBID, and LUV concentrations were 0.4 μm, 200 nm, and 200 μm, respectively. a.u., arbitrary units. C, quenching of tryptophan fluorescence of BAKΔC incubated with or without tcBID in the presence of LUV containing nitroxide moieties located at different depths in the membrane bilayer is shown. Liposome lipid composition was 25doxylPC/35 PE/10PI/30CL. Data from fluorescence quenching experiments were normalized to the fluorescence emission from protein in 25PC/35PE/10PI/30CL LUV, i.e. lacking nitroxylated lipids. Data represent the average and S.E. of 3–4 independent experiments.

